2,215 protein abundance maps at cellular resolution
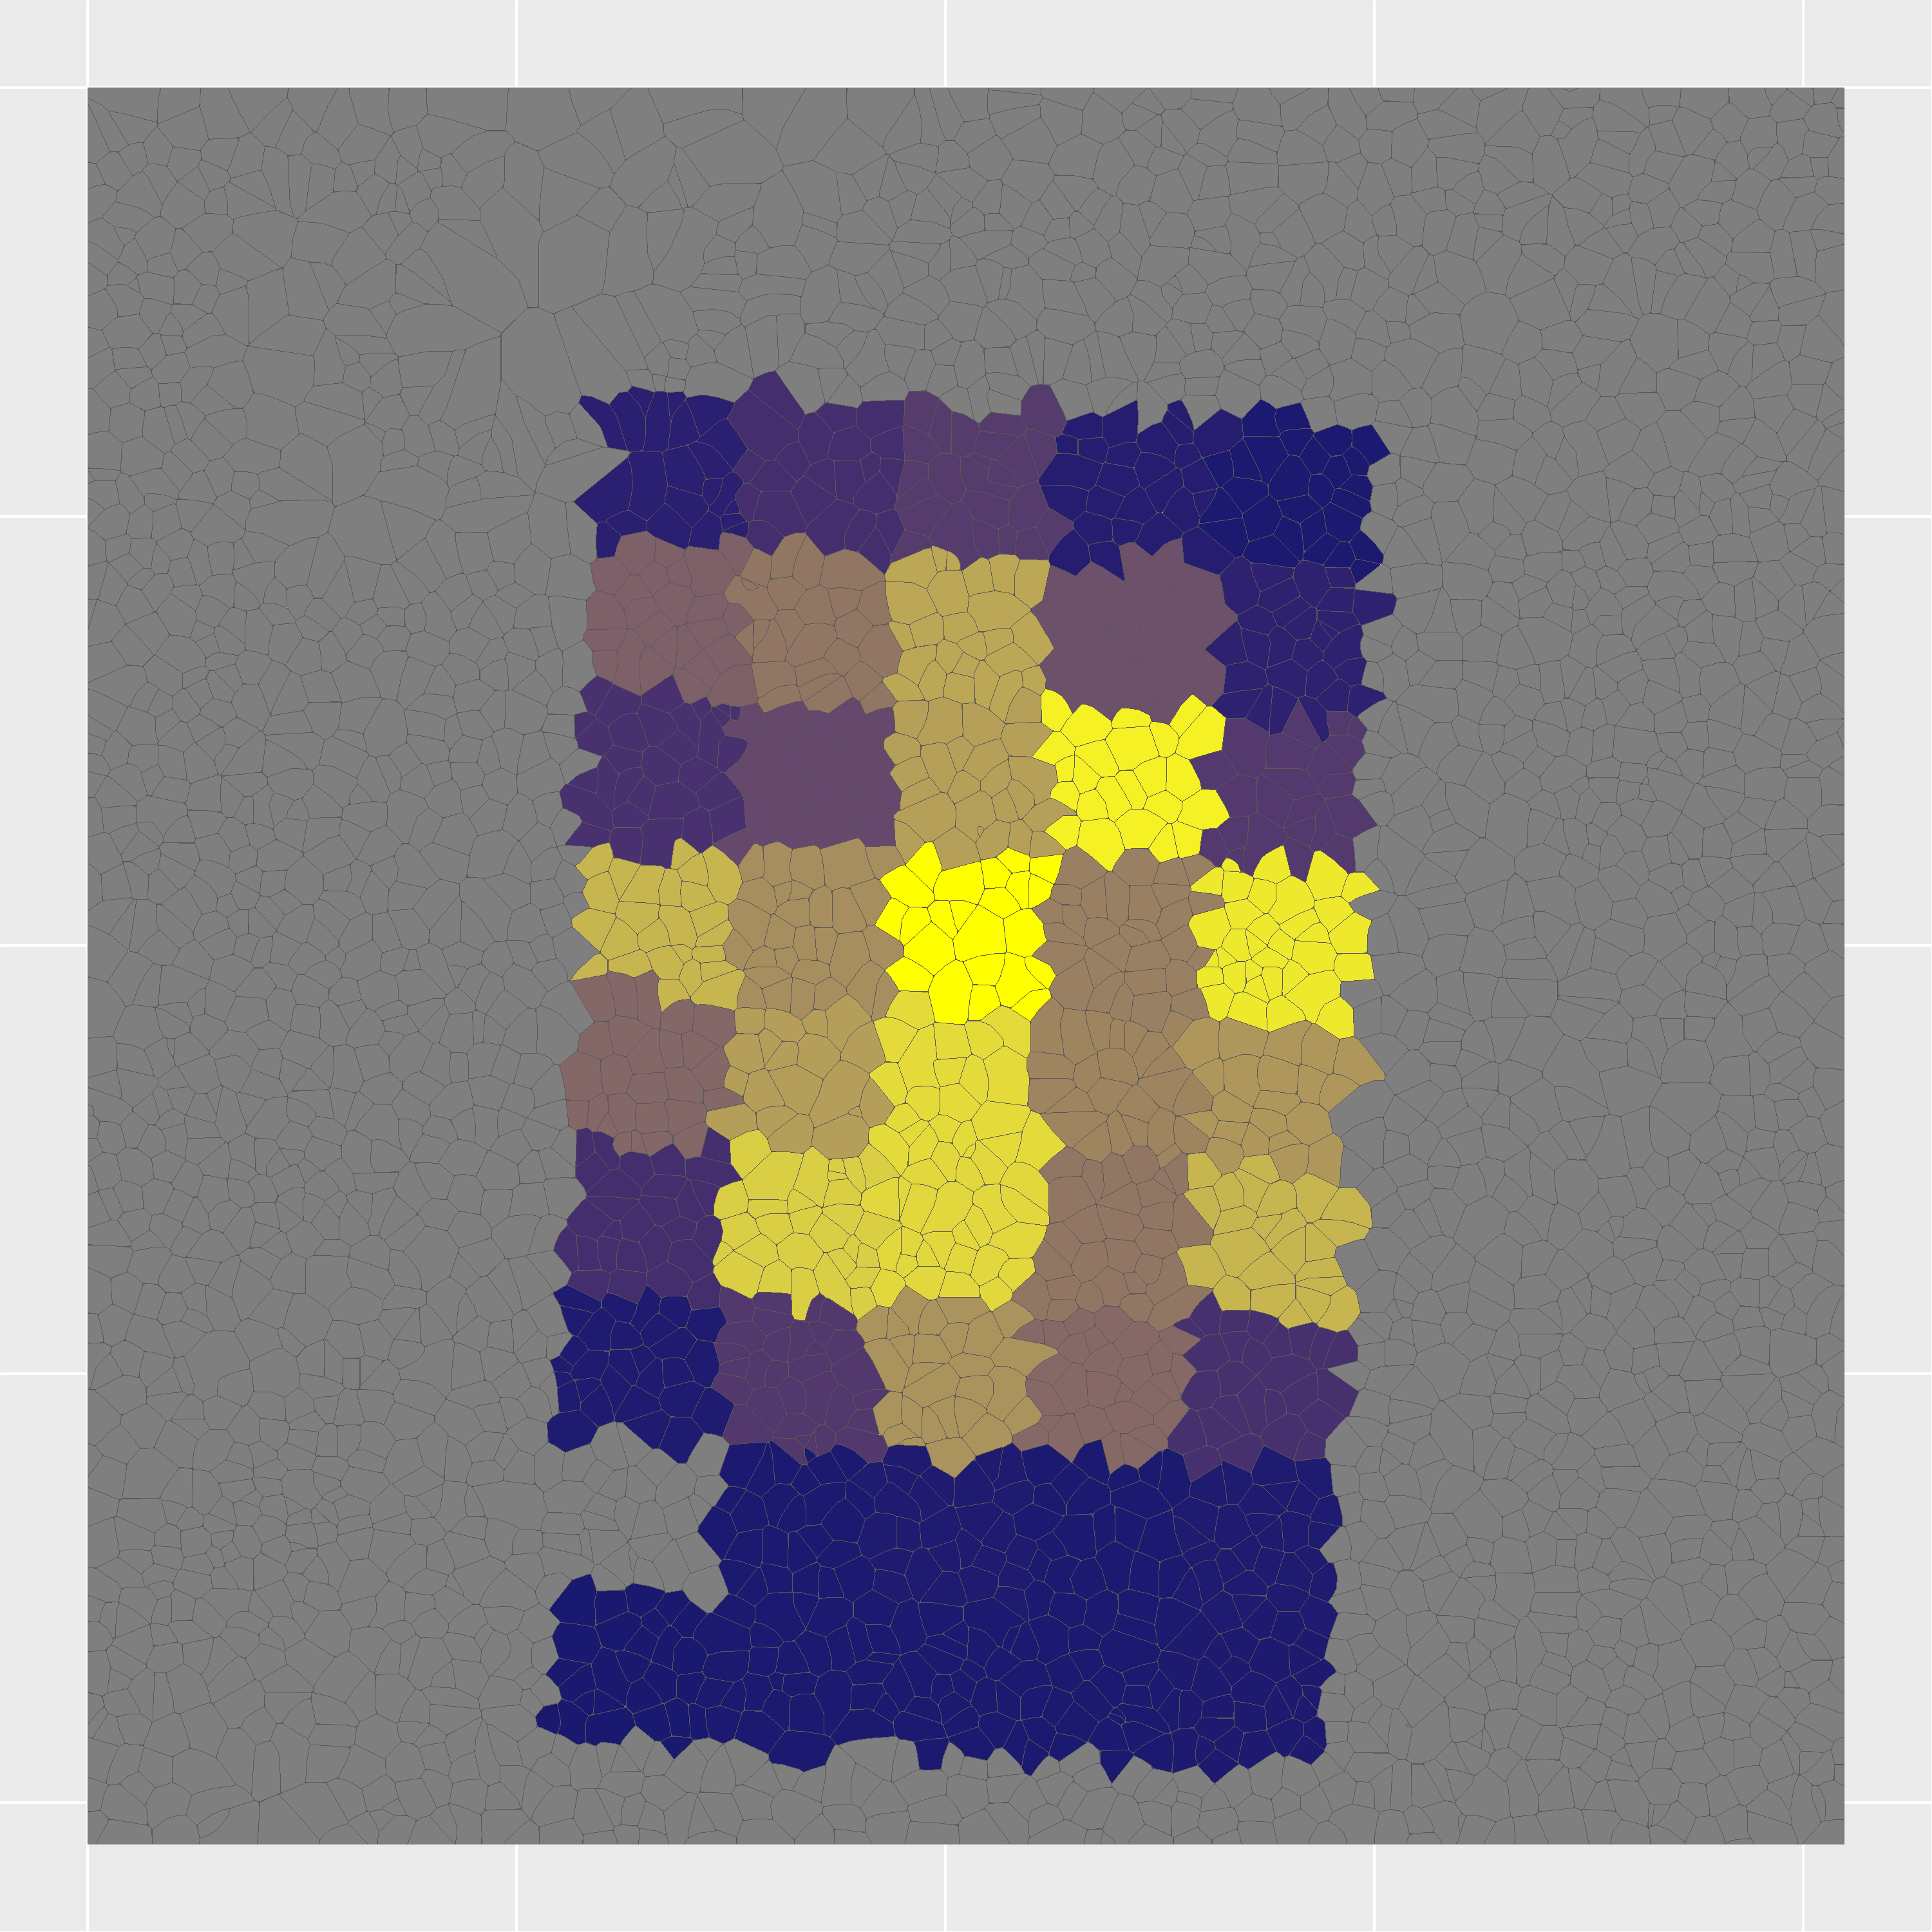
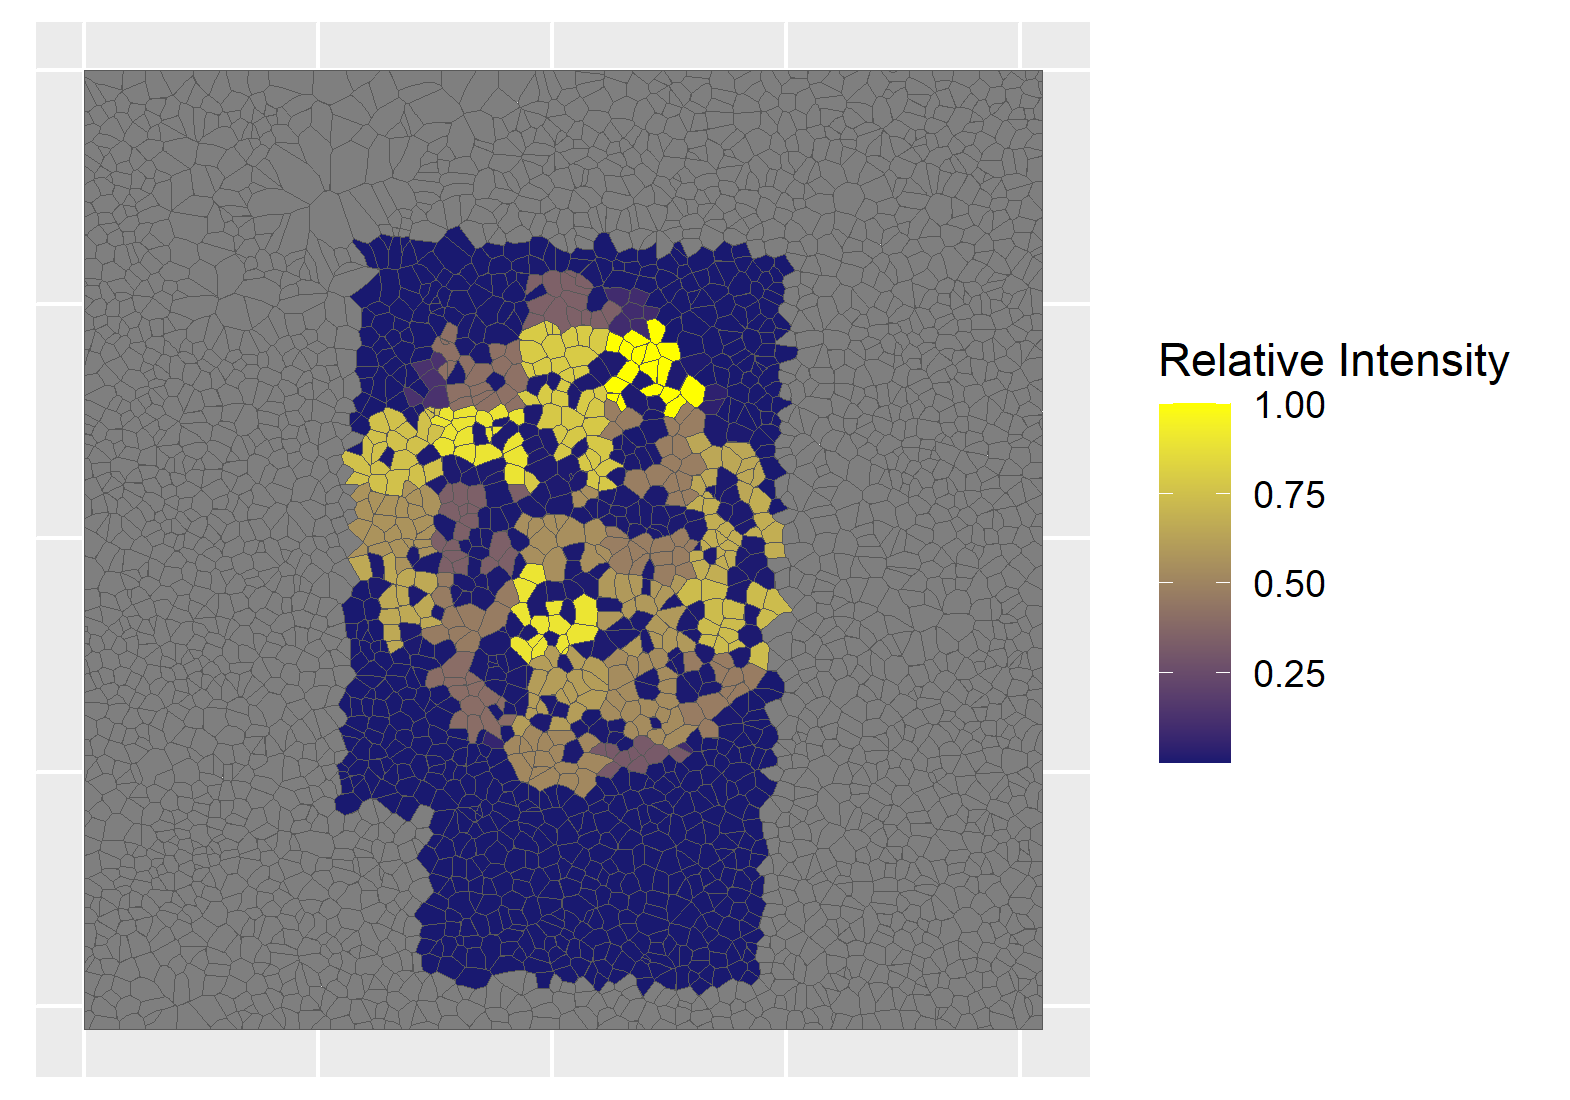
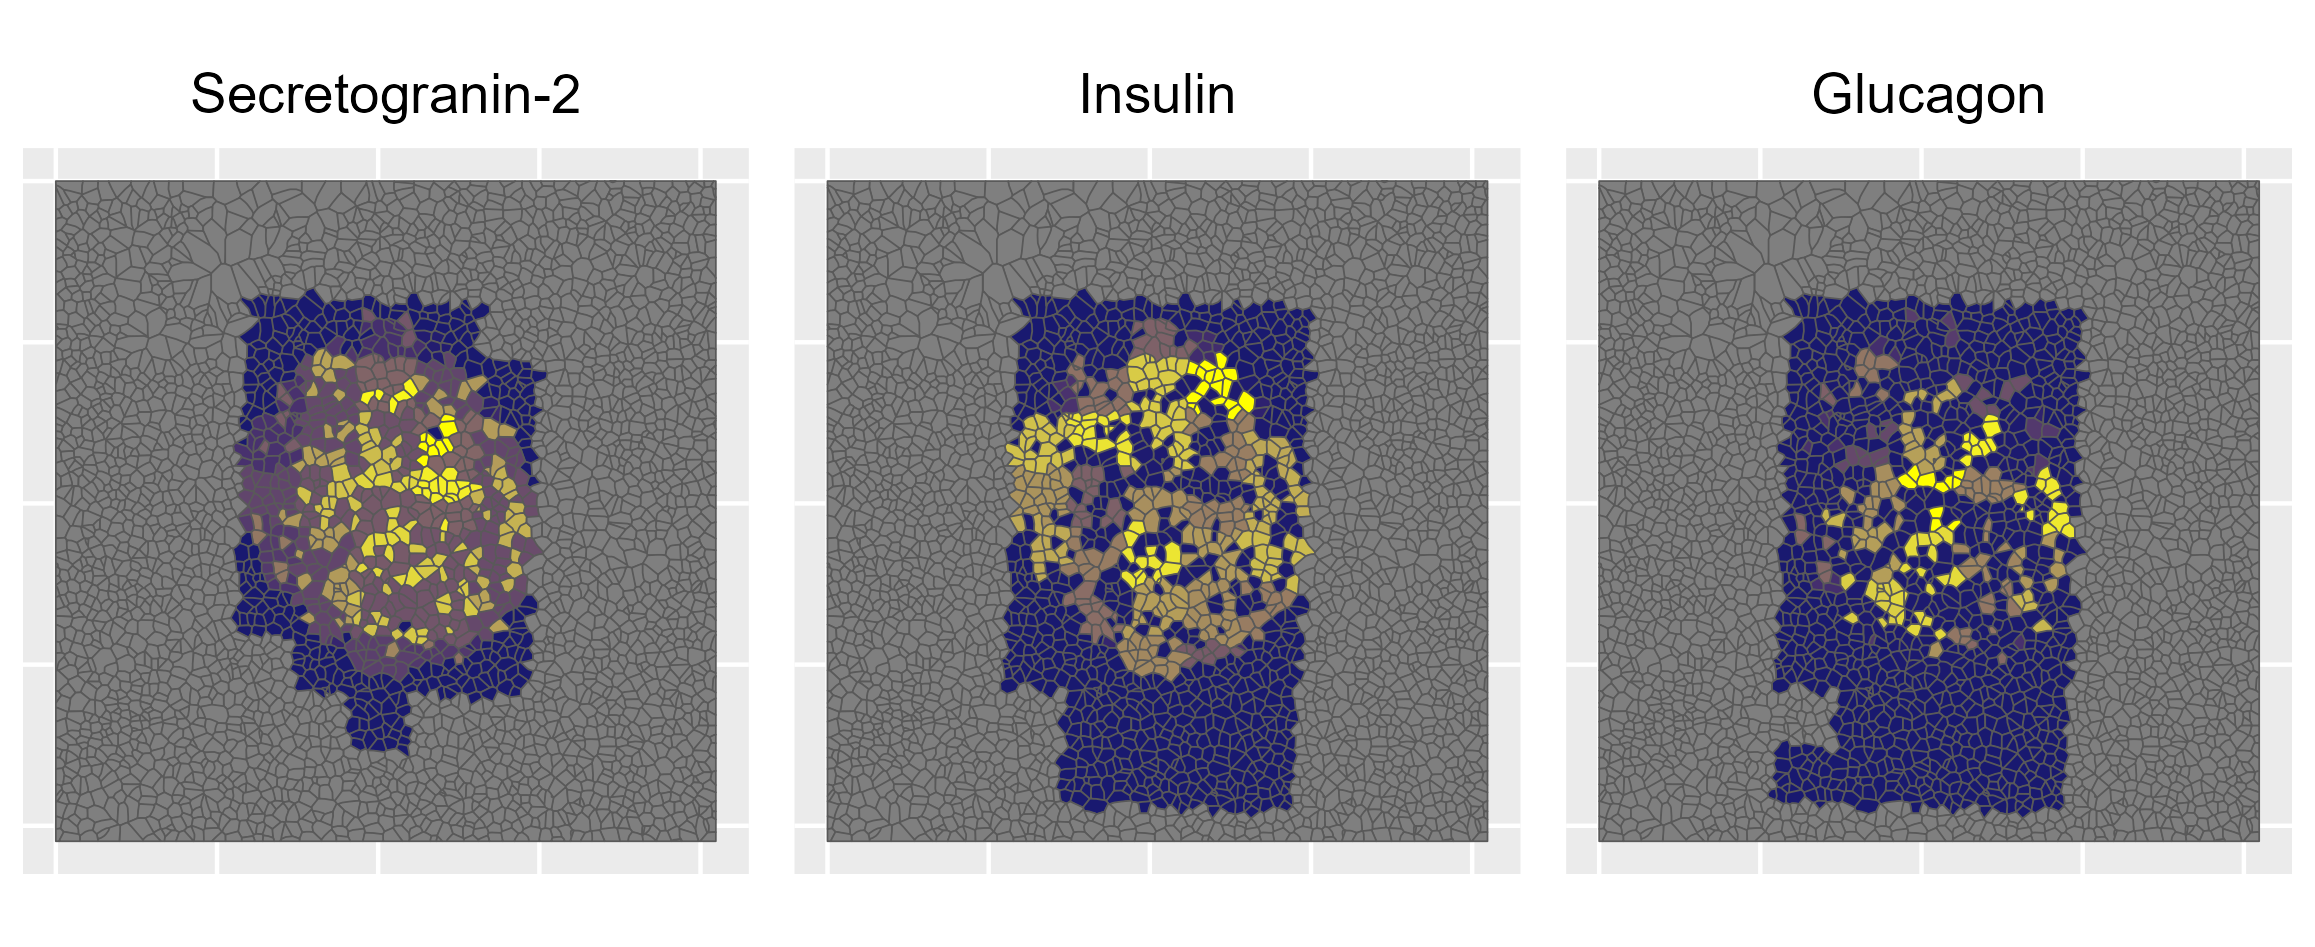
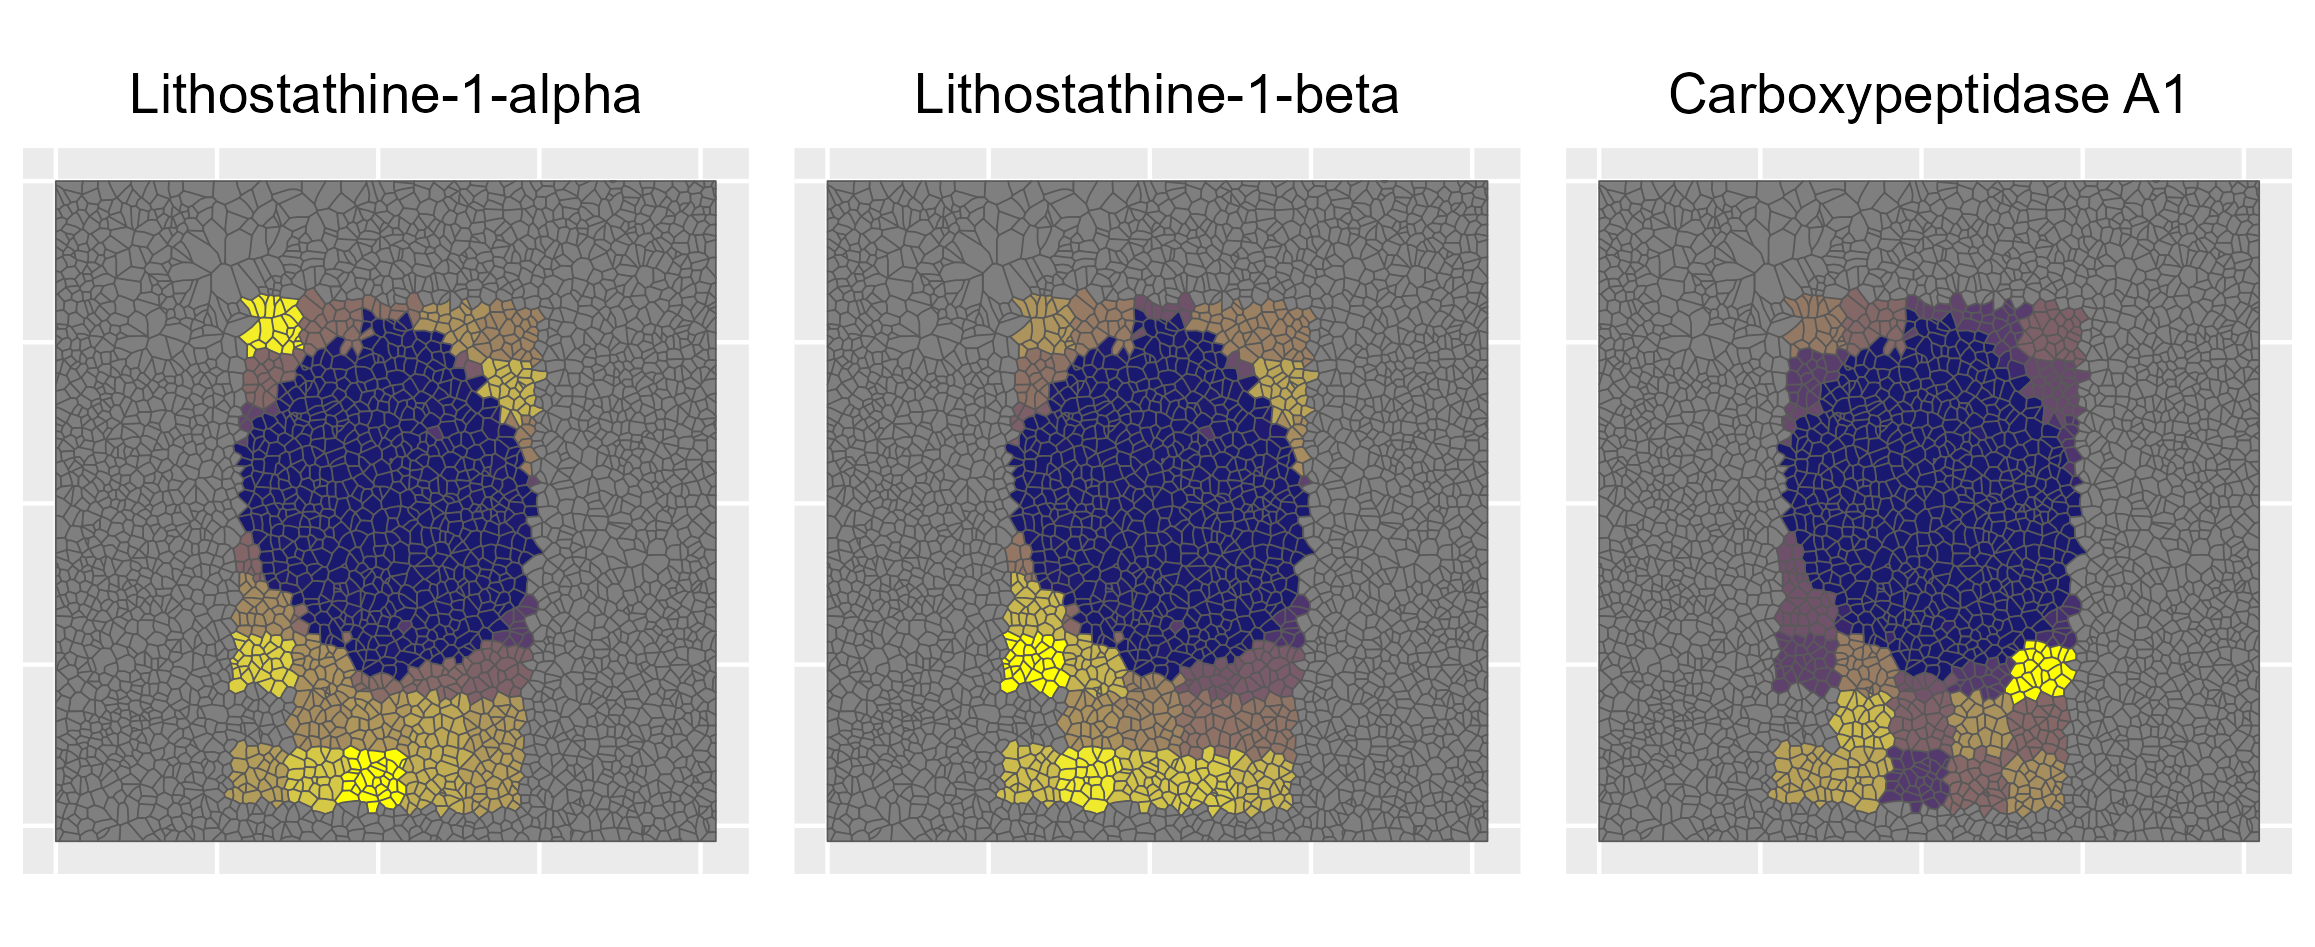
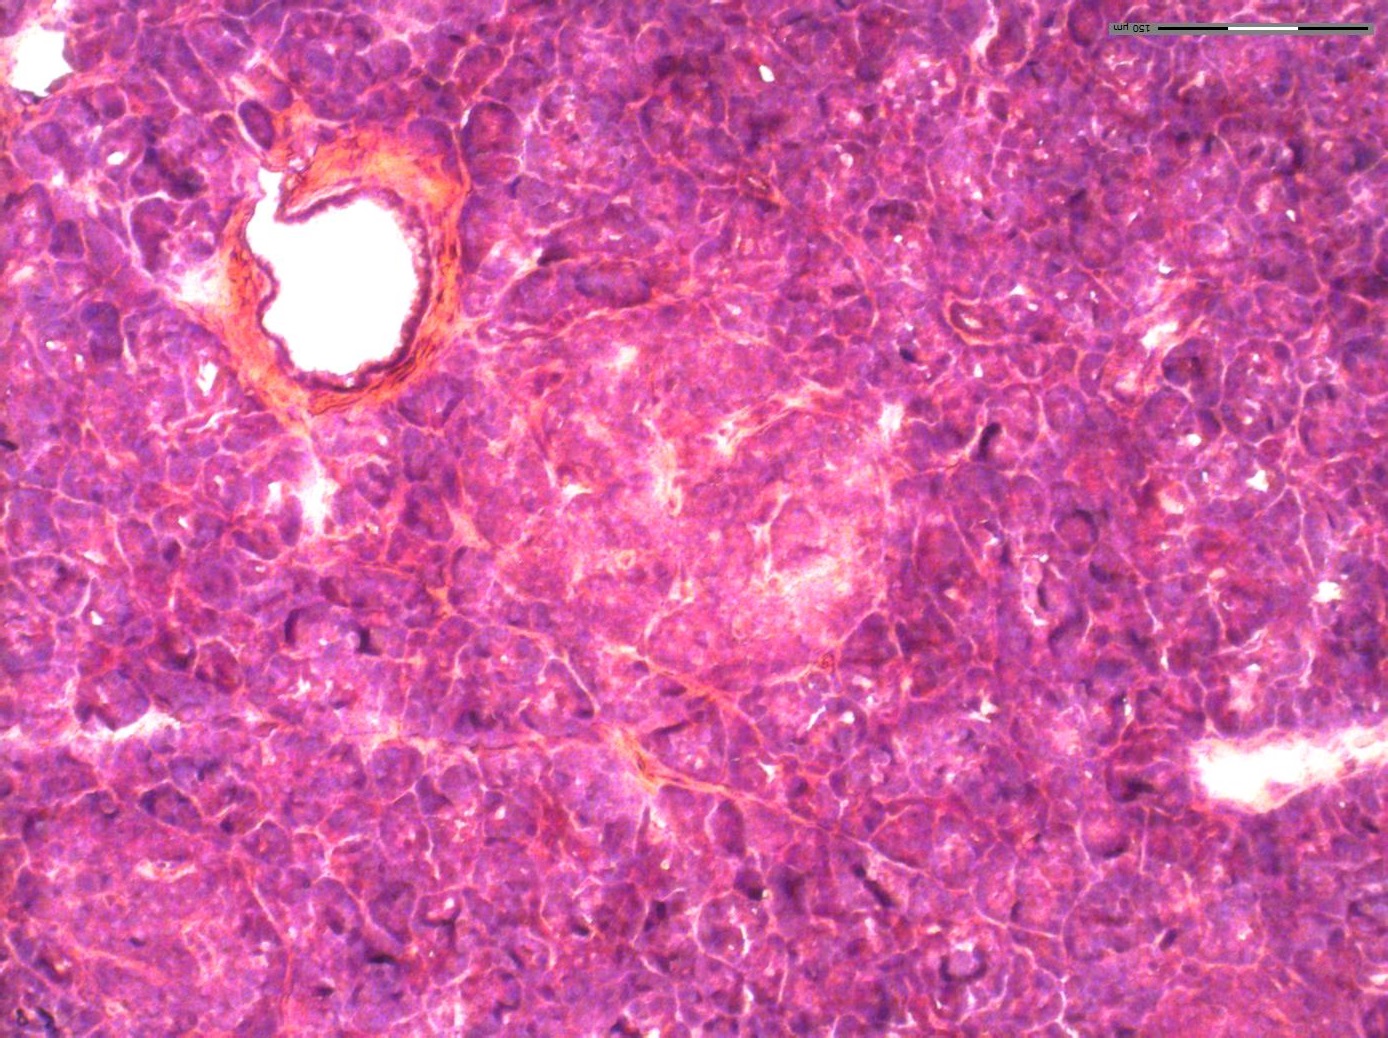
This project presents a novel spatial proteomics workflow that maps protein expression at pseudo-single-cell resolution in human pancreatic islet tissue.
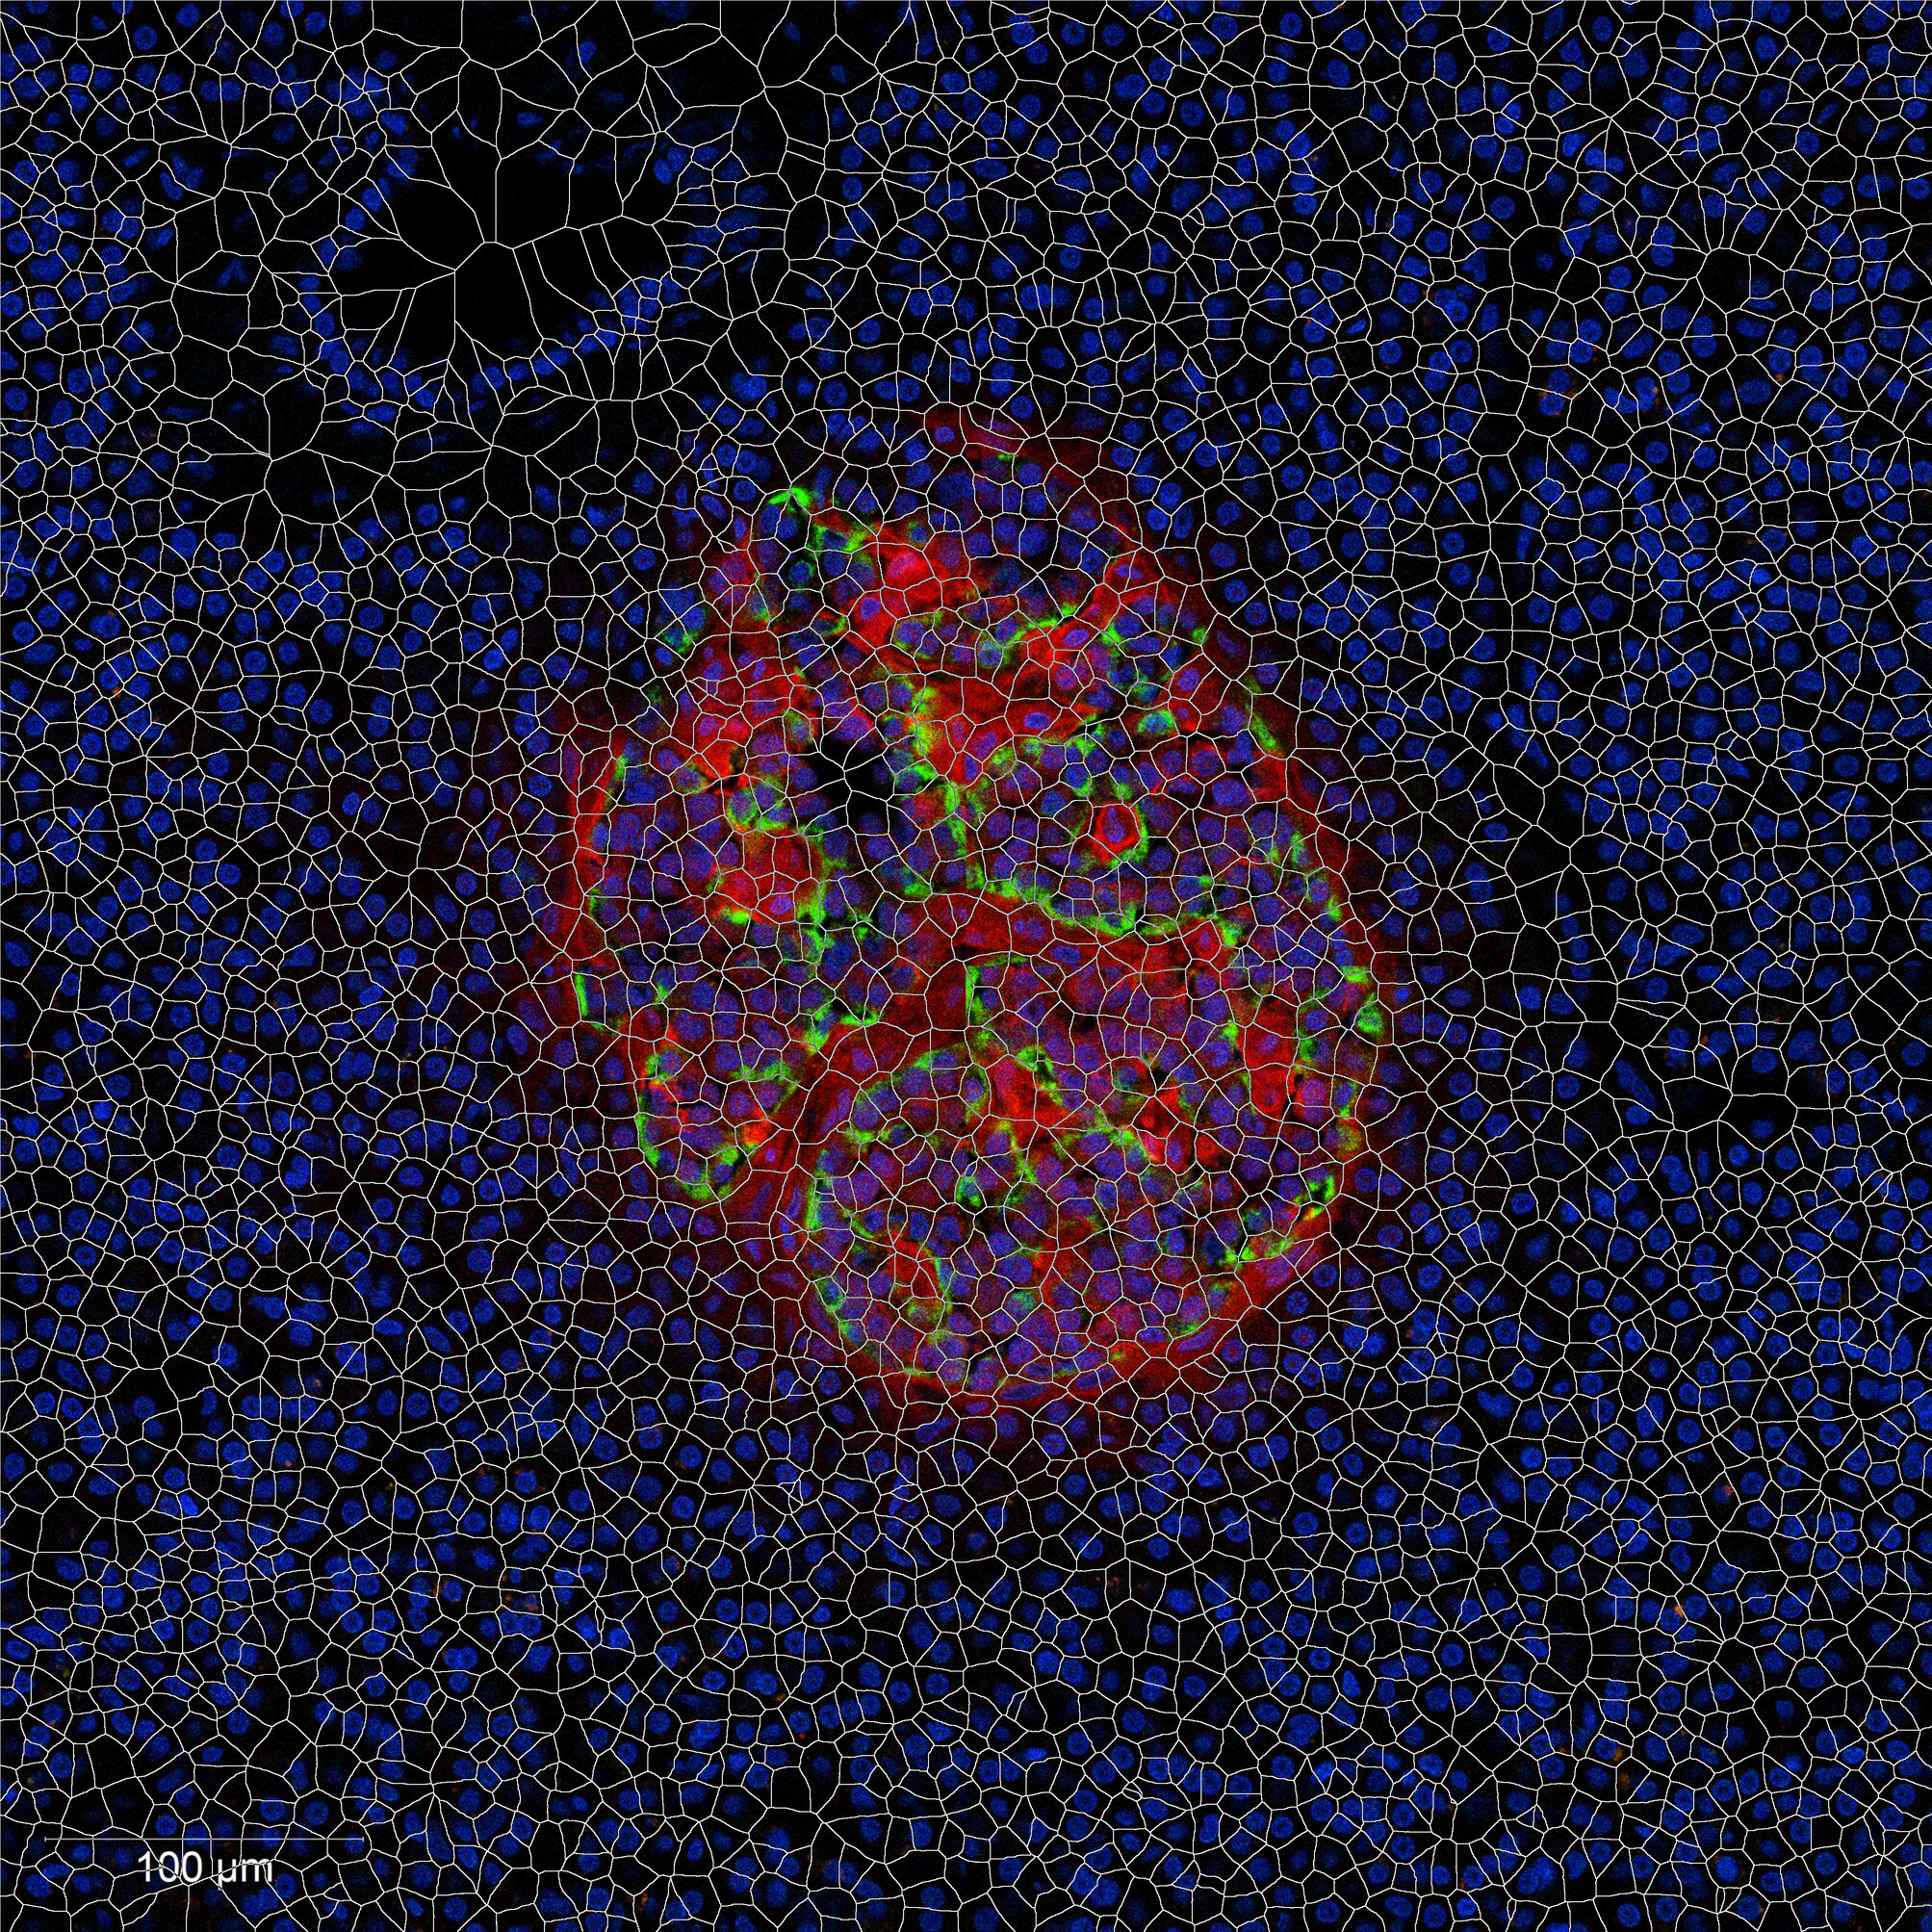
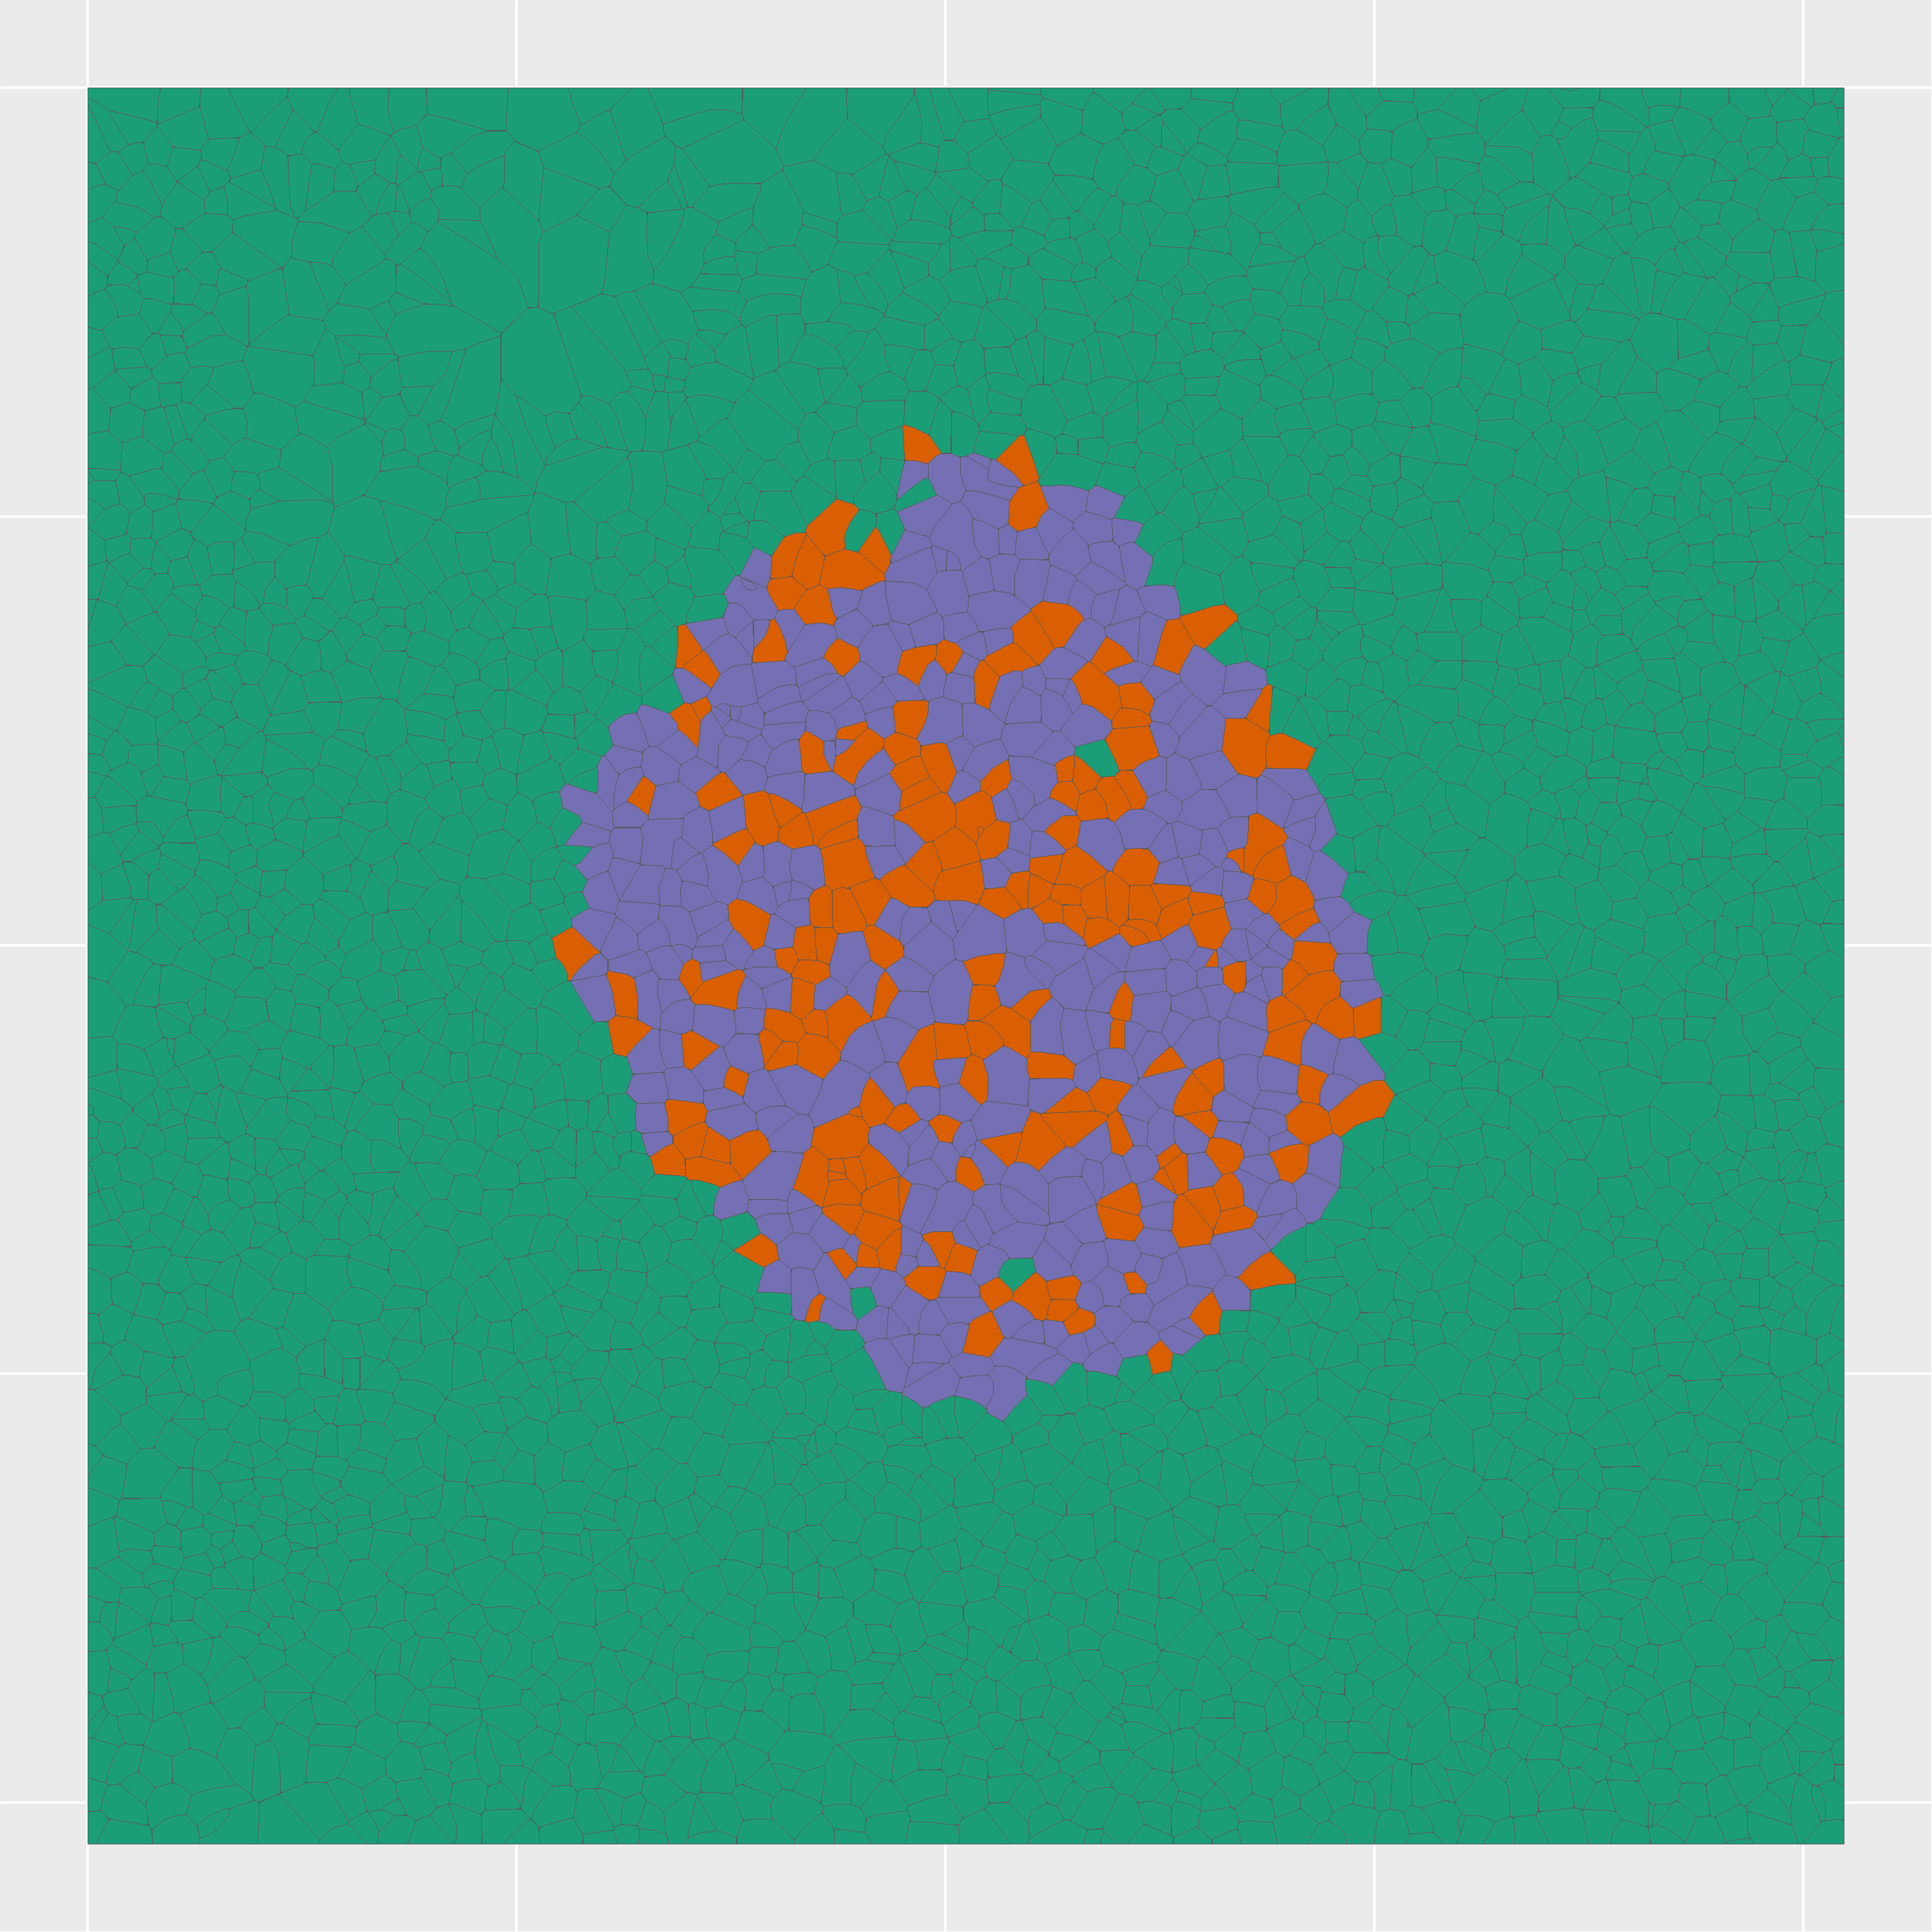
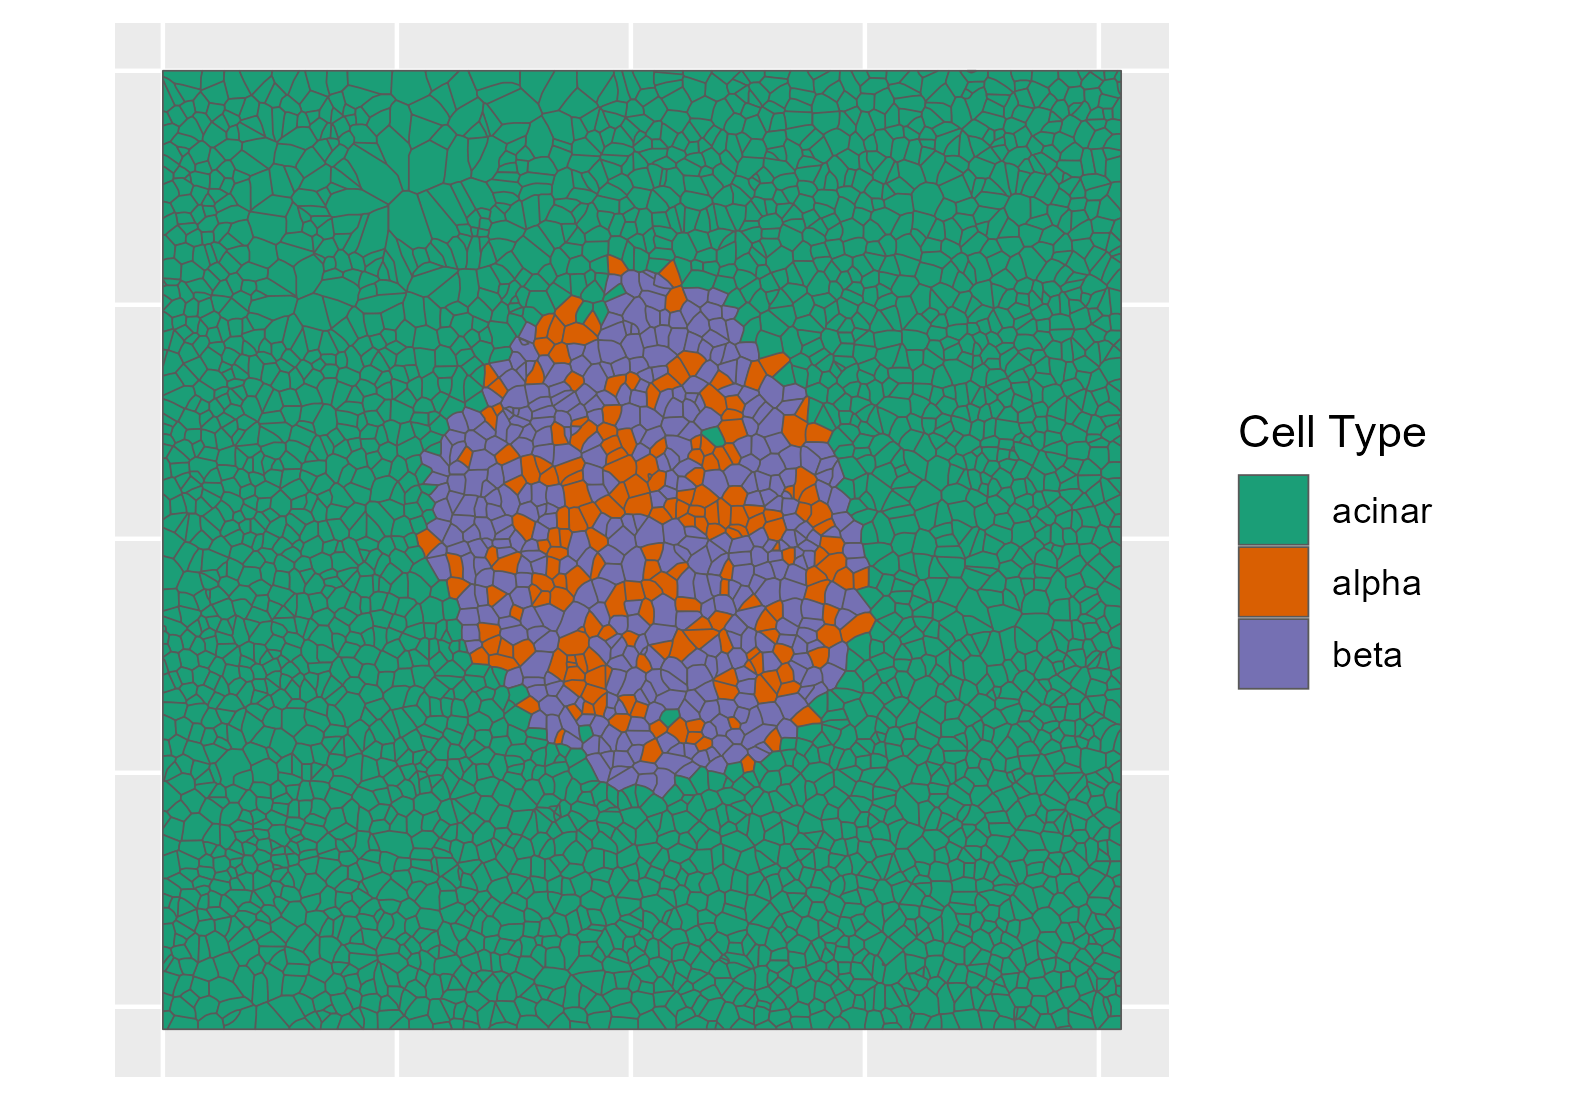
Combining nanopots mass spectrometry with immunofluorescence-guided cell segmentation, we resolve protein abundance across three major cell types—beta (β), alpha (α), and acinar—within a single tissue section.
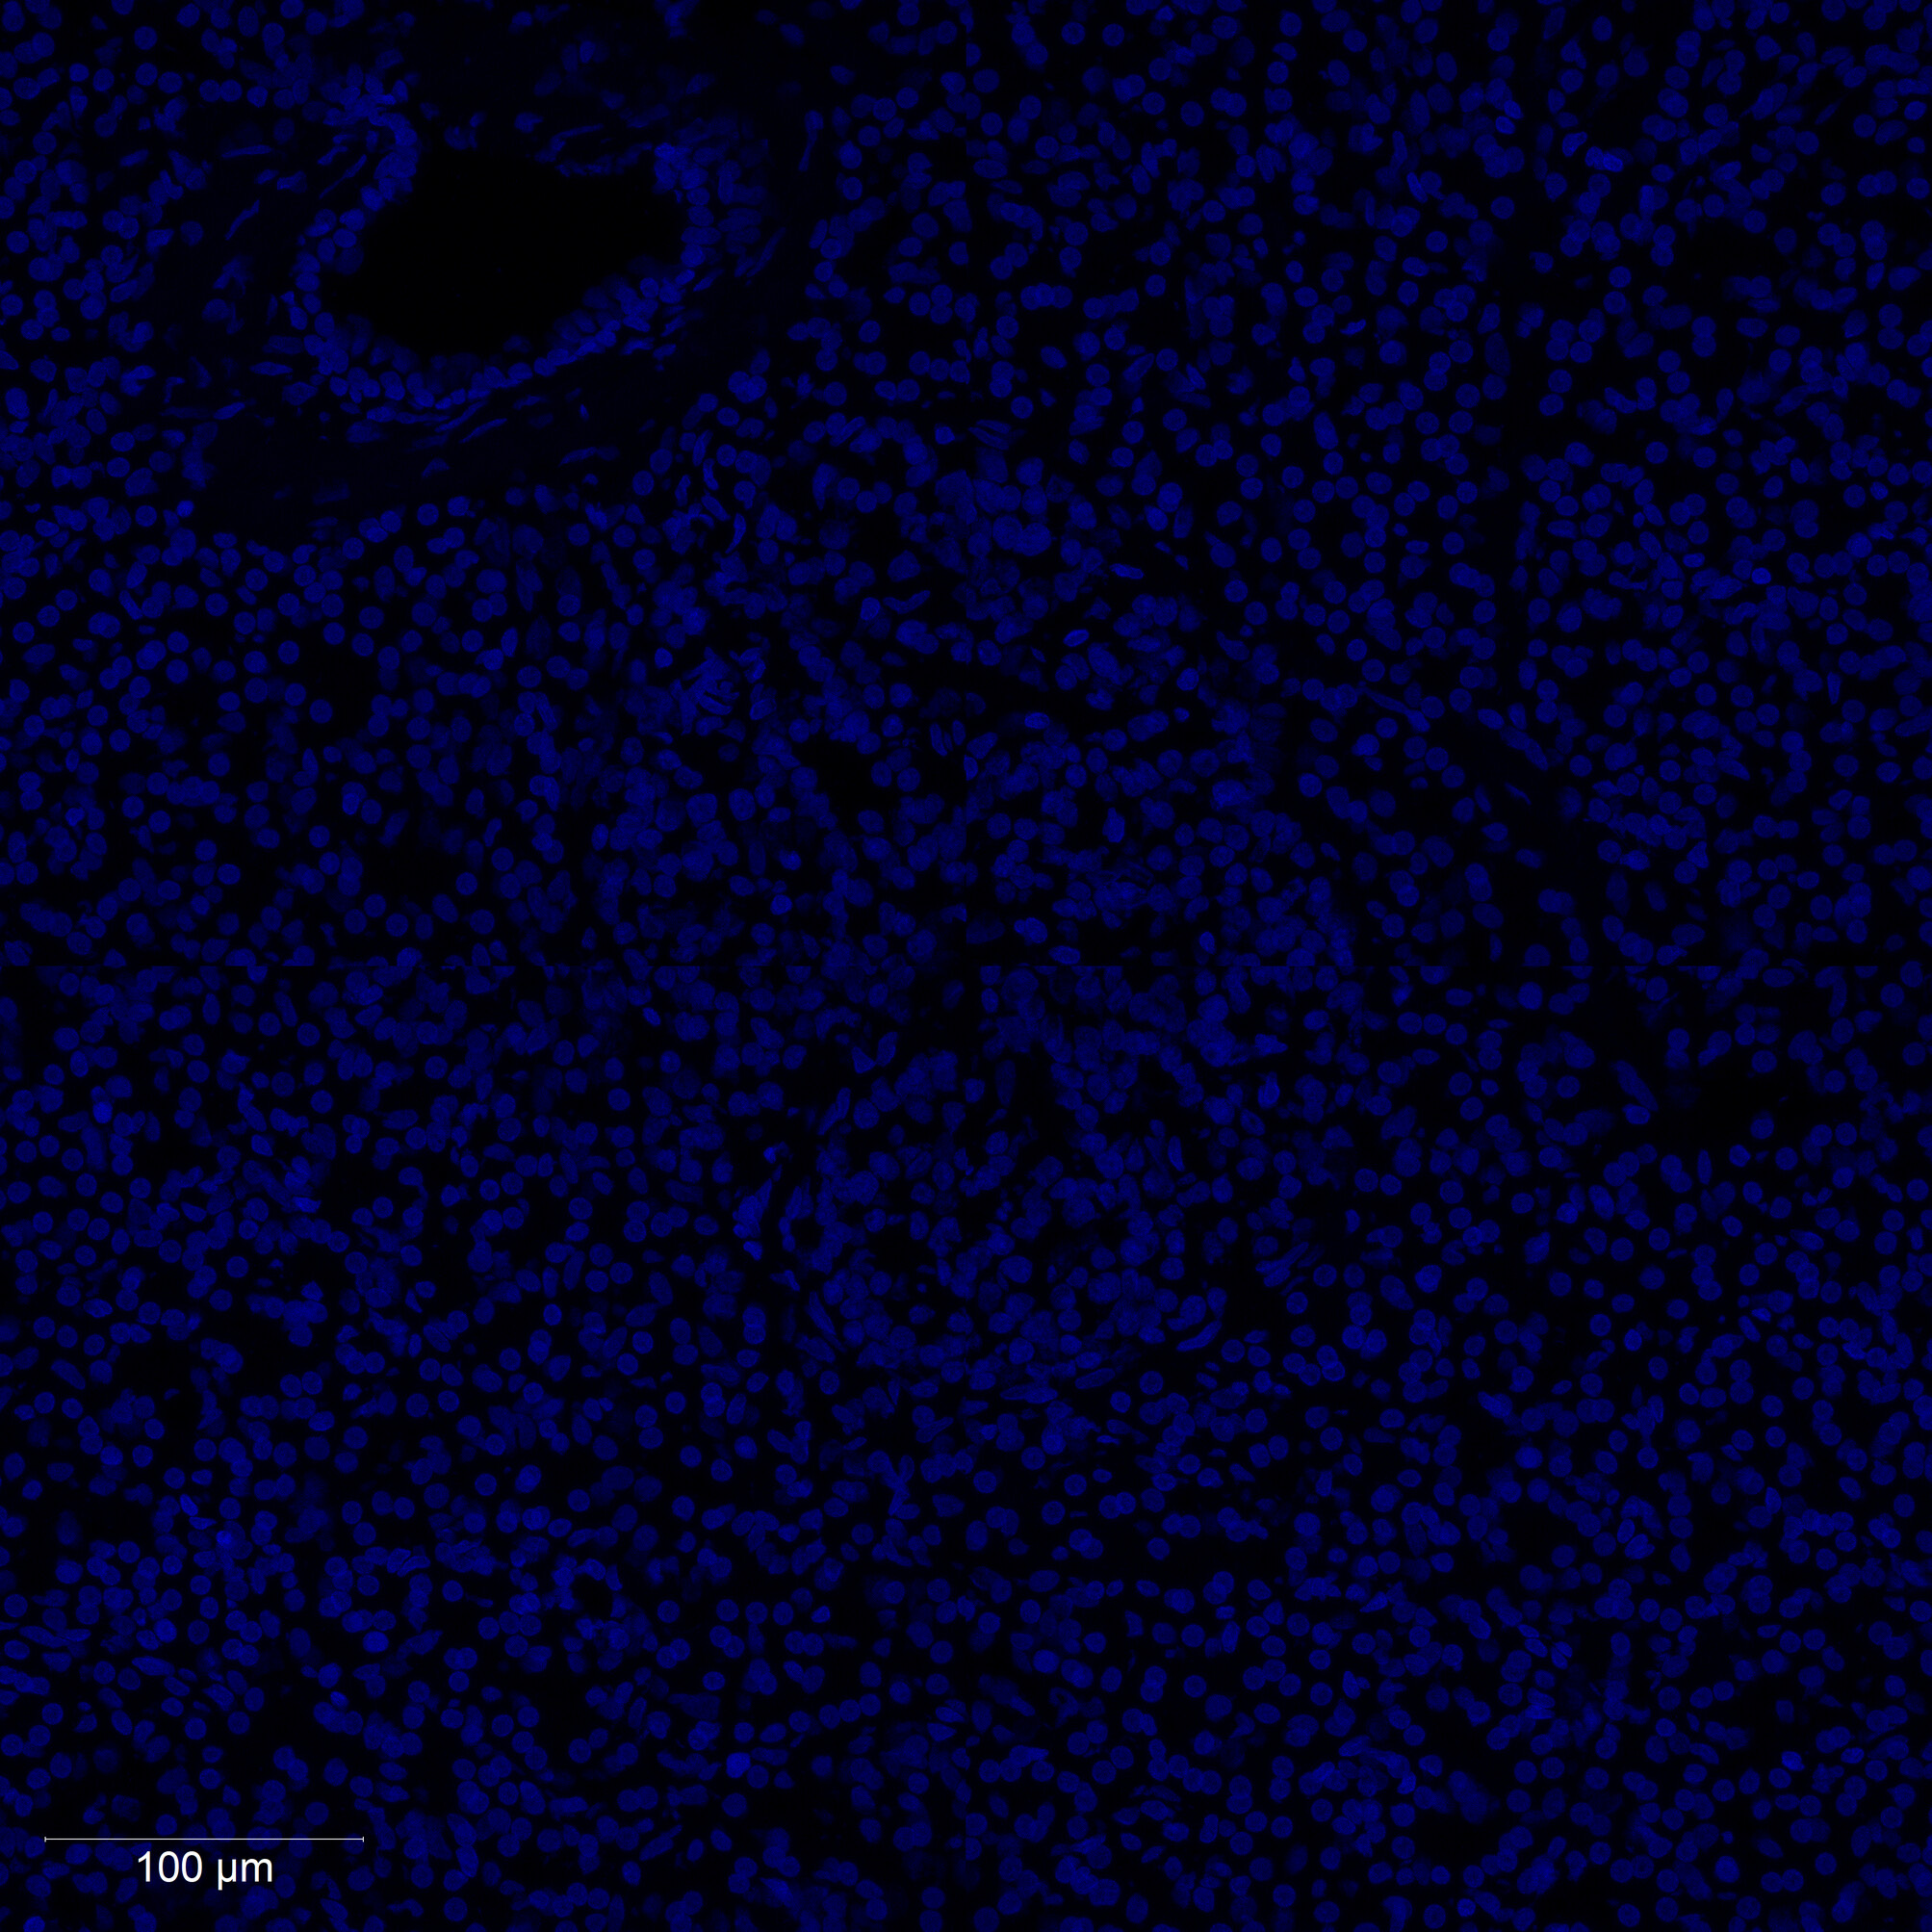
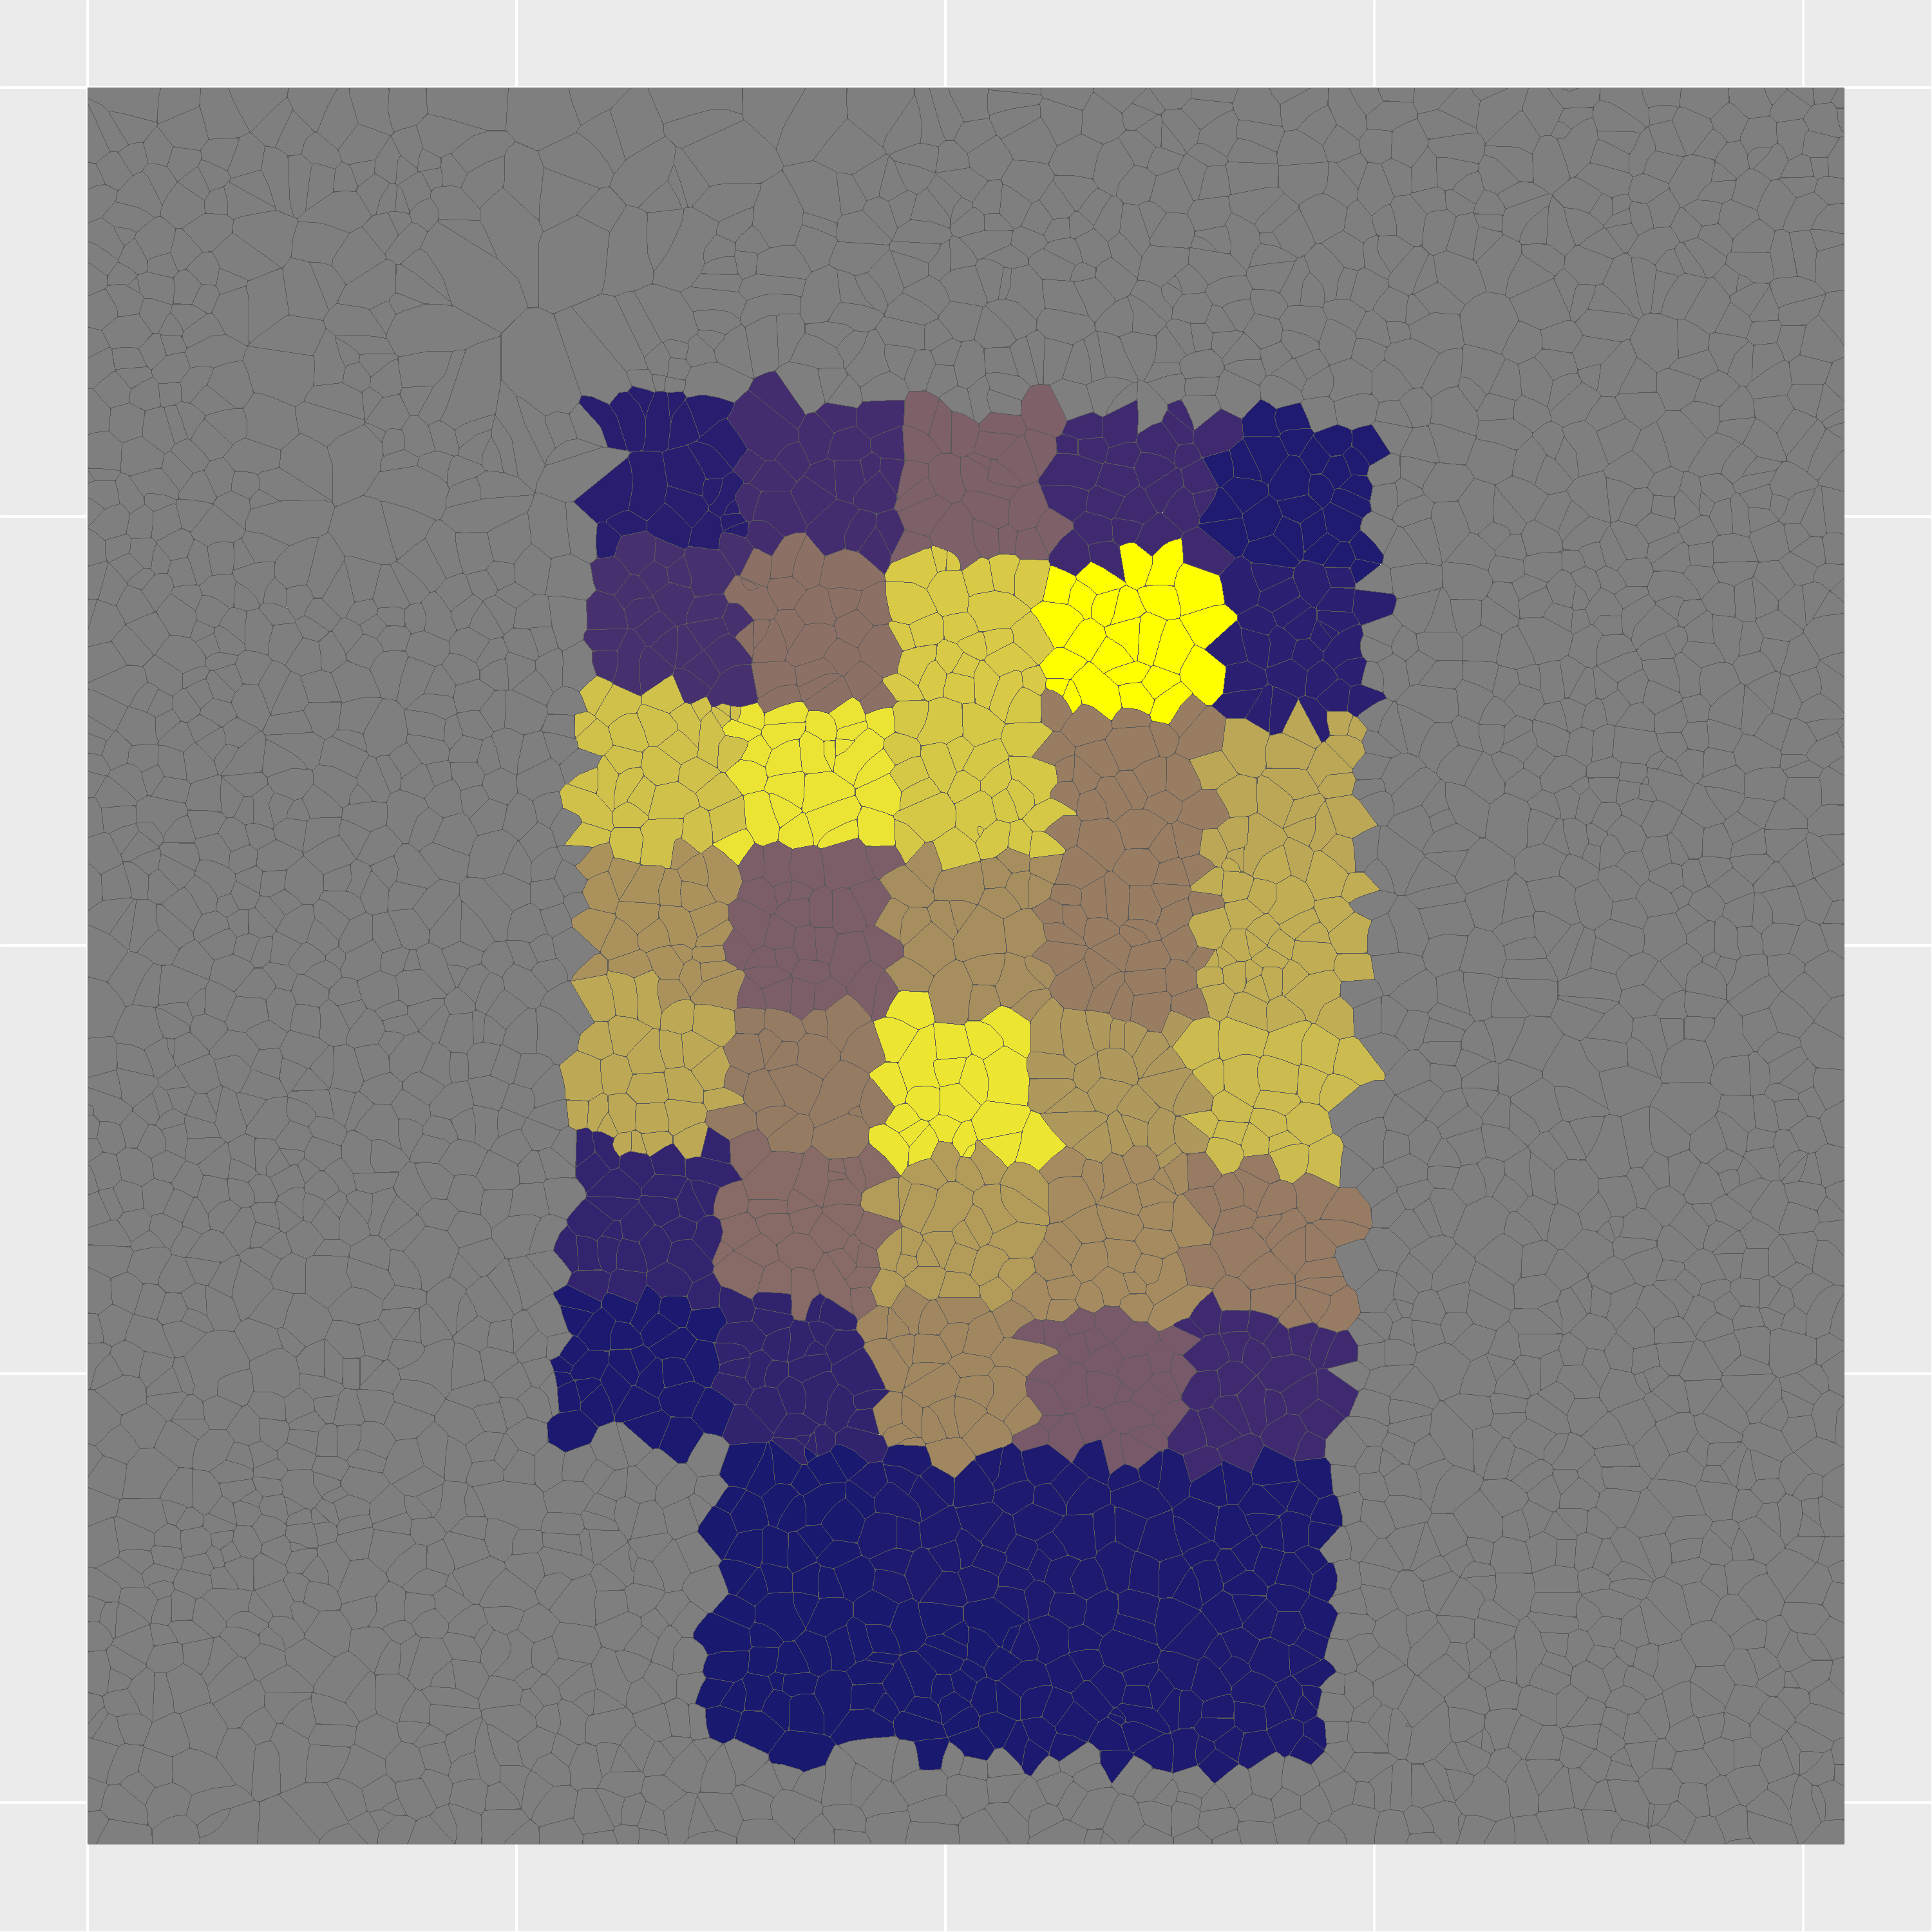
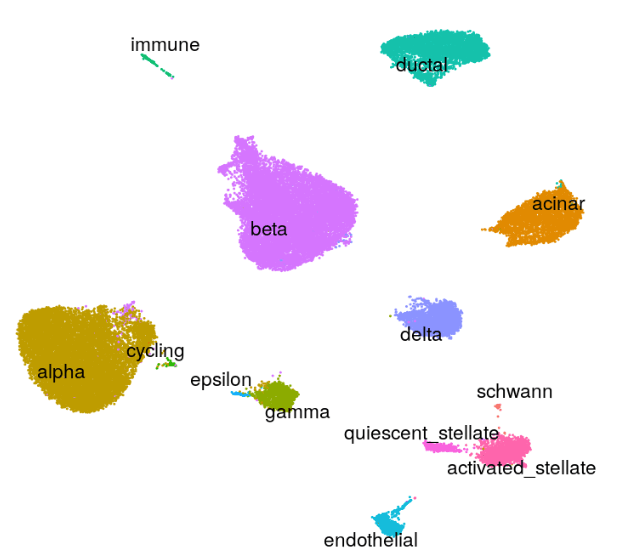
Cell nuclei were identified with CellPose 2.0 deep learning segmentation, boundaries refined in FIJI, and cell types assigned by INS/GCG/DAPI immunofluorescence channel intensities. Single-cell RNA-seq reference data (Azimuth) was used to deconvolve pixel-level proteomics into cell-type-adjusted protein maps.
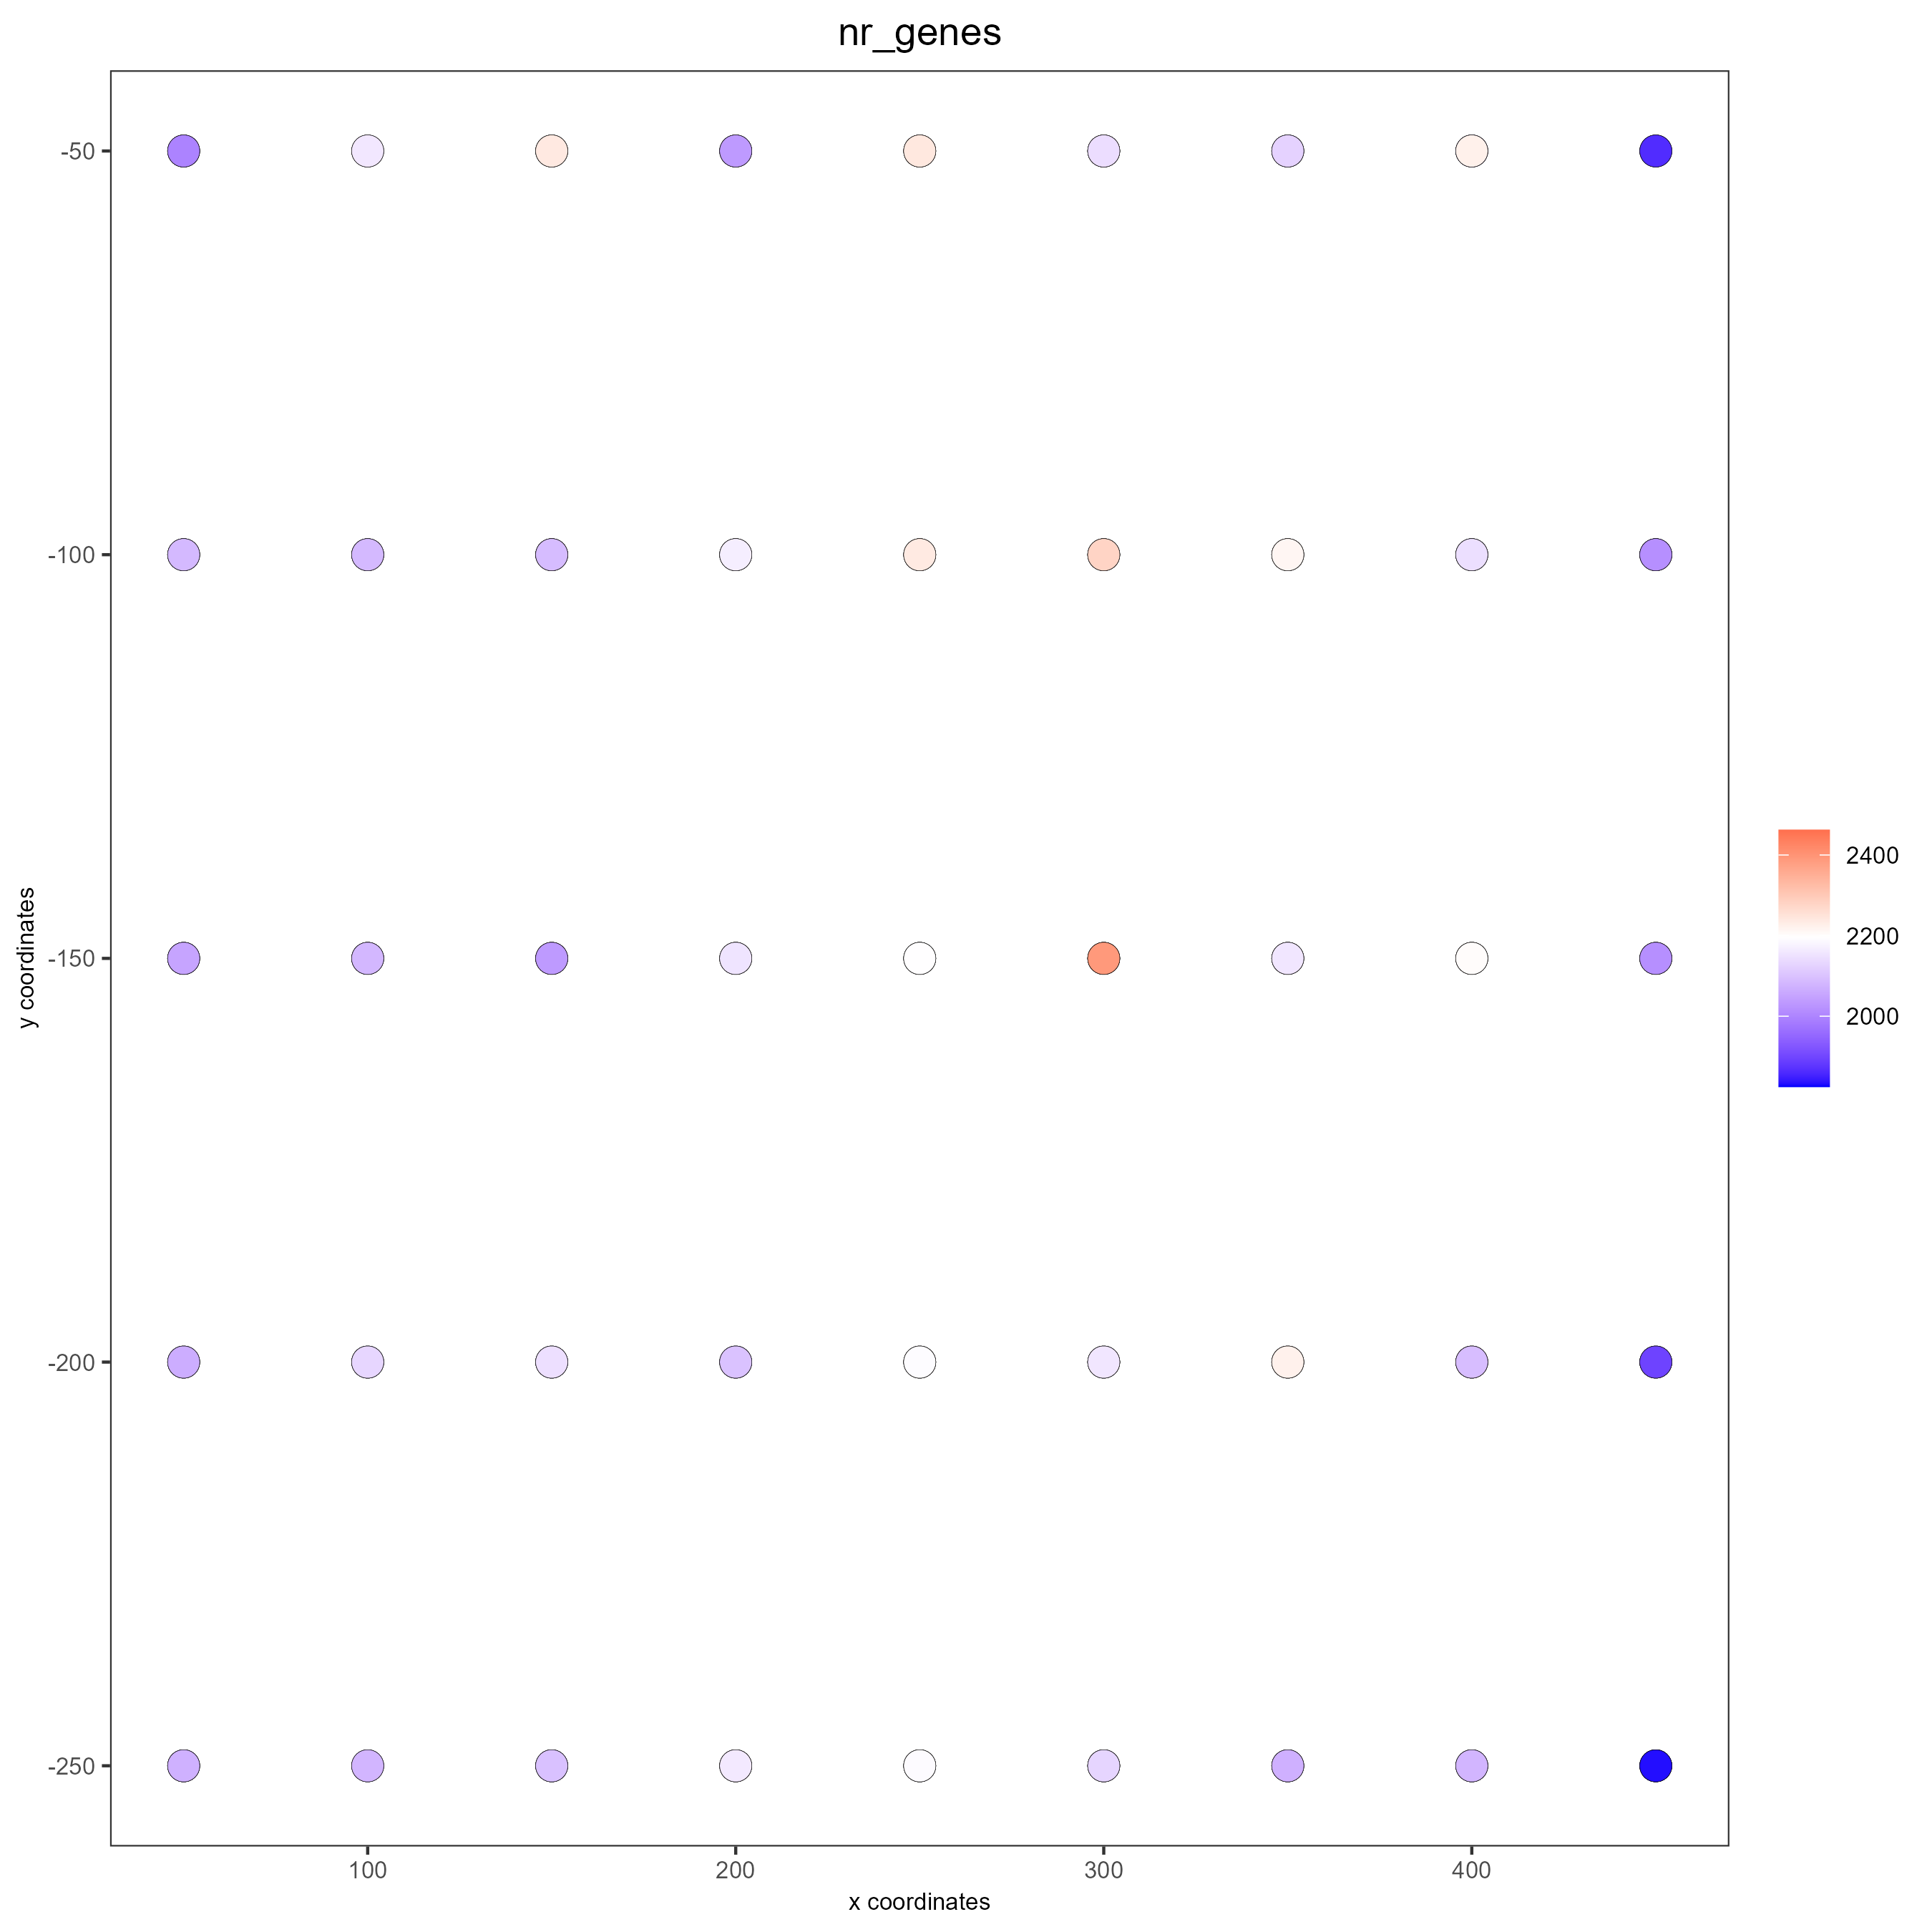
A six-stage workflow from tissue imaging to spatially resolved protein maps.


Validation of spatial protein maps against known cell type markers.
Human pancreatic tissue sections were imaged with multiplex immunofluorescence using DAPI (nuclear), INS (insulin/beta cells), and GCG (glucagon/alpha cells) channels at 10X magnification.
Nuclear boundaries were detected using CellPose 2.0 deep learning segmentation on the DAPI channel. Cell boundaries were refined and ROIs extracted in FIJI/ImageJ using custom macros.
Each cell was classified as alpha, beta, or acinar based on RGB intensity thresholds from the three immunofluorescence channels.
Cells were linked to nanopots mass spectrometry pixels via 8-bit color histogram matching. Protein abundances (log2-transformed) were merged with spatial cell annotations.
Cell-type-specific protein expression ratios were calculated from the Azimuth human pancreas single-cell RNA-seq reference dataset (Seurat). These ratios deconvolve pixel-level proteomics into cell-type-adjusted abundance maps.
For each of 2,215 proteins passing quality filters, cell-type-adjusted relative abundance was calculated and visualized as spatial maps using ggplot2 with sf polygon geometries.